
Google’s 3 Core Web Vitals

What they are and why they matter?
Google is reinforcing the importance of Core Web Vitals with a major update. The gradual rollout began as of mid-June and will be complete by the end of August, giving you plenty of time to make adjustments before it impacts your business. For the SEO community, in particular, this change has significant implications for their strategy moving forward; refining these new metrics can lead not only towards better user experience but also improved ranking!
In order to pass the Core Web Vitals assessment, you need a good score (based on field data) for the following three sections: Largest Contentful Paint (LCP), First Input Delay (FID) and Cumulative Layout Shift (CLS).
Throughout this article, we’ll frequently talk about field data and lab data, so let’s understand what each represents: Field Data is gathered from real users through the Chrome User Experience Report (CrUX for short). Lab Data, on the other hand, is gathered within a controlled environment without any involvement from real users (using Lighthouse).
Now that we’ve understood that, how exactly do Core Web Vitals fit into Google’s ranking algorithm?
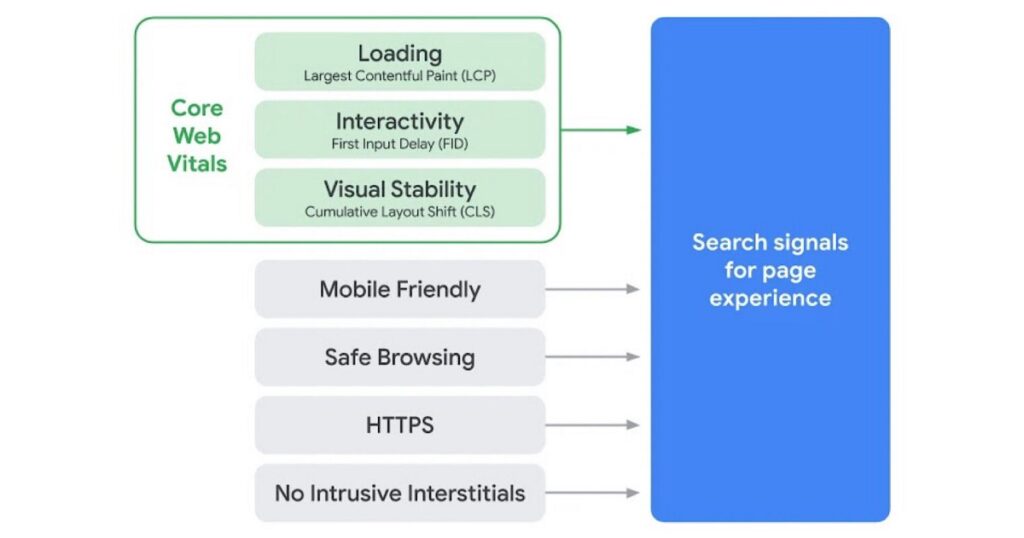
Well, in the past, Google would gauge user experience based on whether a site would be mobile-friendly, offer safe browsing, offer HTTPS and be free of intrusive interstitials. Now they’ve added their fifth factor – Core Web Vitals – and together, these five factors now form the group of signals that Google uses to grade Page Experience. Google had already announced in May 2020 that it plans to incorporate Page Experience as a core component of Google Search ranking. This is part of a broader strategy to improve overall web user experience.
It’s also important to note that Core Web Vitals will most likely be a moving target, which is something you’d expect from metrics measuring user experience. The web and its users are constantly evolving, so it’s only natural for CWVs to evolve along with them.
What are Core Web Vitals?
The famous Top Gun quote “I feel the need…the need for speed!” probably comes to mind, but Core Web Vitals are about more than just speed.
Core Web Vitals are a set of user-centric metrics that measure loading speed, responsiveness and visual stability, helping site owners get a better idea of how users experience their website.
Web Vitals are split into two groups: Core and non-Core Web Vitals.
Core Web Vitals are:
- Largest Contentful Paint (LCP)
- First Input Delay (FID)
- Cumulative Layout Shift (CLS)
Non-Core Web Vitals are:
- Total Blocking Time (TBT)
- Time to Interactive (TTI)
- Speed Index (SI)
- First Contentful Paint (FCP)
Each metric measures how “solid” one aspect of the Page Experience is.
These Web Vitals help you gain a deeper insight into a site’s performance. You can use this information when making decisions to improve your website performance, meet business goals and fulfill customer needs.
Why should you care about Core Web Vitals?
The following are the three major reasons why you should care about your website’s Core Web Vitals:
- Visitors love fast sites that are easily accessible on any device, from any location. The bottom line is: you’ll win more visitors if they can access your website without having a difficult time navigating or waiting for it to load. More visitors mean more prospective customers!
- As of mid-June 2021, Core Web Vitals have become a ranking factor in Google’s algorithm. While we don’t expect to see an immediate shift and relevance remains much more important, we do anticipate that its importance will grow over time as it becomes one of the most prominent ways for websites to rank better on search results pages.
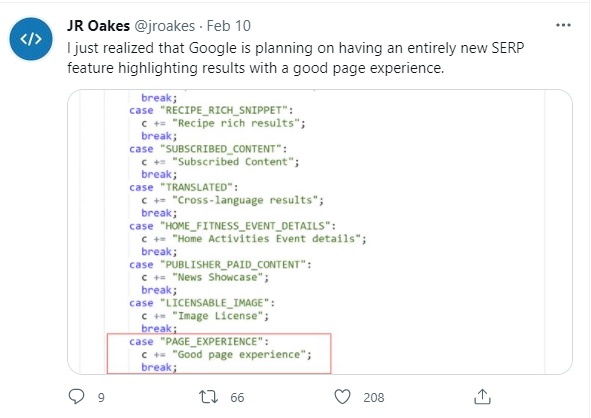
- Google has dropped hints that they may start displaying a “Good Page Experience” badge in their search results. You can be sure that this is more than just an empty gesture, as it influences searcher behavior which feeds back into Google’s algorithms and helps you rank higher.
- Passing the Core Web Vitals assessment will not only improve your site’s user experience but also ensure fewer visitors retreat back to the SERP. In fact, according to a study in 2009 by Akamai, if a page takes more than three seconds to load, as many as 40% of its visitors would abandon the site. With average attention spans decreasing across users globally, we can predict that this percentage is even higher today!
In February 2021, JR Oakes (Sr. Director, Technical SEO Research at Locomotive Agency and Author at SearchEngineLand.com) was scrolling through Google Search Console’s front-end code when he detected that Google has already made some preparations for the new Page Experience badge:
Web Vitals in Detail
Let’s dive into the nitty gritty of each of the Web Vitals metrics. We will start with the Core Web Vitals!
Largest Contentful Paint (LCP)
Largest Contentful Paint (LCP) is a Core Web Vital that measures the time in seconds from when the page starts loading to when its largest text block or image element renders on screen. It aims to measure how long it takes for a site’s main forms of content, like large blocks of text and images, to load onto users’ screens. The lower LCP score, the better! A fast LCP ensures that users do not have to waste their precious time waiting for a page to load its main content. You can measure a website’s LCP using both field and lab data.
In the field, the browser stops reporting new LCP candidates when the user first interacts with the page (via clicking, scrolling, or switching tabs). In the lab, however, it’s not very clear when the LCP is done loading. We expect that this moment occurs when the page is nearing Time to Interactive (TTI), and the final LCP candidate is made apparent.
Important considerations
While loading a page, the largest body of text or image could change. To measure LCP accurately, the most recent candidate is used when it becomes larger than any other on-screen element.
For example, consider an H1 heading being your biggest text block at first but then you load in a bigger image element. The image will now be your leading candidate for measuring LCP.
Note: elements are not currently counted as candidates for measuring LCP, so if you have a big logo loaded up as an , it won’t count towards this metric due to simplicity reasons. We anticipate that this may change in the future.
It’s still unclear whether Google considers elements as LCP candidates or not.How to interpret your LCP score?
Here’s how you can interpret your LCP score:
- Good: <= 2.5s
- Needs improvement: > 2.5s and <= 4s
- Poor: > 4s
What causes a Poor LCP score?
There are several possible causes of a poor LCP score, however, a few common ones are: slow server response time, render-blocking CSS and JavaScript, and your largest content resources being too heavy.
How to improve your LCP score?
With a little extra effort, you can make your site load faster with techniques like optimizing the critical rendering path for browser processing, minimizing CSS and caching assets. For more information on how to accomplish that check out web.dev’s resources on LCP score optimization.
First Input Delay (FID)
First Input Delay (FID) is a Core Web Vital that measures the time in ms (milliseconds) between the user’s first interaction with your website (i.e. clicking a URL, or button, or tabbing through) and the browser’s initial response to that interaction.
The FID indicates a user’s first impression of your site’s responsiveness and interactivity. And as the old adage goes, “Your first impression is your last impression”!
You can only measure FID using field data, as it relies on user interaction data. The lower the FID, the better your website’s responsiveness.
For lab testing and debugging purposes, the Total Blocking Time (TTB) metric is used, as it’s closely correlated with the FID.
Important considerations
The FID does not take into account the time it takes the browser to process an interaction, nor does it consider the time it takes for the user interface to update afterward.
When it comes to measuring FID, scrolling and zooming aren’t considered interactions, since they’re continuous in nature and have very different performance constraints (i.e. the scrolling action is performed by the GPU rather than the CPU, or more specifically, the CPU’s compositor thread rather than the main thread).
How to interpret your FID score?
Here’s how you can interpret your FID score:
- Good: <= 100ms
- Needs improvement: > 100ms and <= 300ms
- Poor: > 300ms
What causes a Poor FID score?
One of the most common causes of a poor FID score is when a browser’s main thread is focusing on parsing and executing JavaScript code and cannot respond to user inputs or interactions.
How to improve your FID score?
In order to improve your FID score, you’ll need to assess what’s holding the browser back from going interactive. The following are examples of things you can do to lower your FID score: reduce the duration of JavaScript execution, break up longer tasks, and use a web worker to run JavaScript on a background thread.
There are a lot of things that can affect your FID score and some might not even be relevant to you. However, if you want more information on how to improve it, we recommend checking out web.dev’s resource on FID score optimization!
Cumulative Layout Shift (CLS)
Cumulative Layout Shift (CLS) is a Core Web Vital that measures the cumulative score of all unexpected layout shifts within the viewport during any given page’s lifecycle. The aim is to measure visual stability, as this heavily influences user experience. CLS can be found in both field data and lab data: lower scores indicate greater visual stability!
Unlike the other CWV’s, CLS isn’t measured in seconds. CLS measures the movement of unstable elements between two frames and works from the viewport size. The total layout shift score is the product of two components – the “distance fraction” and the “impact fraction”.
The “distance fraction” represents the greatest distance the unstable element travels between both frames, divided by the viewport’s longest dimension. Whereas, the “impact fraction” represents the area of the viewport that the unstable element occupies in both frames.
To build a better understanding of how to calculate your CLS score, check out this useful resource.
Important considerations
A page’s entire lifecycle is often measured for days or even weeks. This means that the CLS field data and lab data will be vastly different, because while tools only gather lab information over a brief period of time, pages can remain open much longer.
Testing for unexpected layout shifts can prove quite tricky in lab environments as some functions may not be enabled or they might behave differently. For example, cookie notifications might not pop up, live chat might be disabled, and personalized content may not load.
How to interpret CLS scores?
Here’s how to interpret your CLS score:
- Good: <= 0.1
- Needs improvement: > 0.1 <= 0.25
- Poor: > 0.25
What causes a Poor CLS score?
The main causes of a poor CLS score are: ads or images that have undefined dimensions, resources that load asynchronously, and DOM elements that are dynamically added above existing content that has already loaded. This pushes away the content that has already been loaded and reduces the visual stability of the page.
How to improve your CLS score?
There are many ways to prevent unexpected layout shifts on your website. One simple way is by always including size attributes for all of the images and videos you upload onto it, as well as not inserting any content above other content that’s already been loaded into a user’s browser window. Check out web.dev’s article on CLS score optimization for mor
e information about how these changes can help improve overall performance!
Conclusion
With the digital economy taking precedence, media optimization will only grow in importance. Slower websites that have a low CWV score won’t be able to compete with those who optimize their content and rank higher on Google’s Search Engine Results Pages. So don’t let your visual media and content work against you by not optimizing it properly- instead try to ensure your site is running as smoothly as possible so people actually want to stay there! Make media optimization a priority today!